What is a media kit?
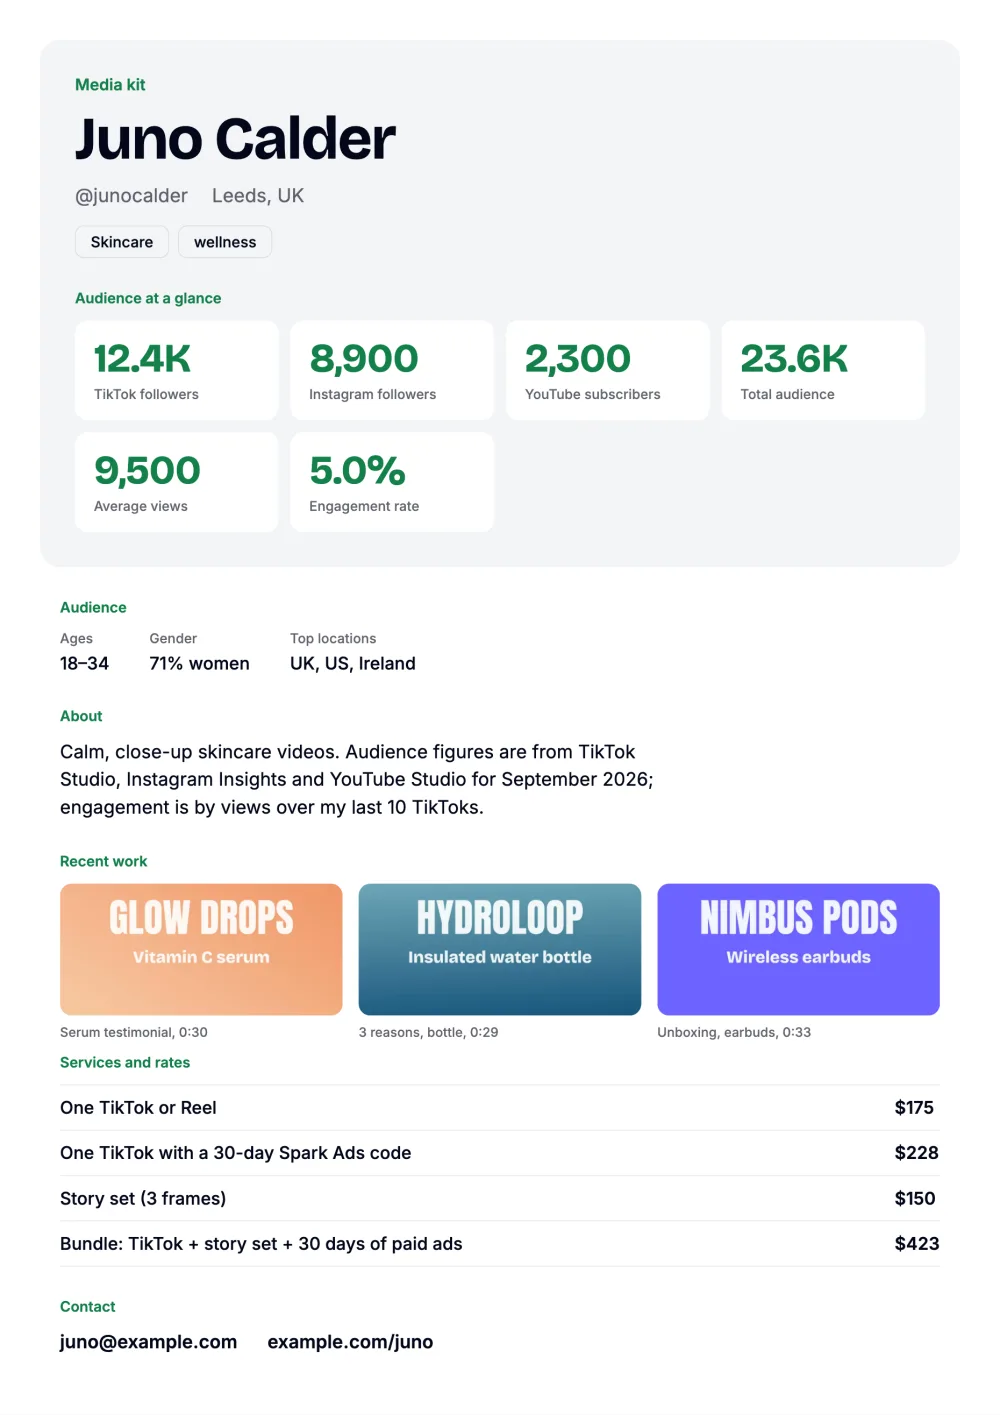
A media kit is a one or two page summary a creator sends to brands before a sponsorship: who you are, the platforms you post on and how many people you reach, who those people are, examples of your work, what you offer, what it costs and how to contact you. It answers the questions a brand would otherwise ask over several emails.
It leads with audience numbers because the brand is paying for posts on your accounts. If you make videos for brands to post themselves, a UGC portfolio fits better: the same builder, with samples first and followers optional.
How do you work out your engagement rate?
For TikTok, Hootsuite's guide (October 6, 2026, checked October 14, 2026) calls engagement rate by views the standard approach: likes, comments, shares and saves, divided by views, times 100. To average it over several posts, work it out for each post and take the mean. Here it is for the last 10 TikToks of Juno Calder, a creator we made up with 12,400 followers.
Engagement rate by views over 10 posts (made-up numbers)| Post | Views | Likes + comments + shares + saves | Rate |
|---|
| 1 | 8,200 | 330 + 24 + 22 + 31 = 407 | 4.96% |
|---|
| 2 | 15,900 | 690 + 52 + 61 + 74 = 877 | 5.52% |
|---|
| 3 | 4,100 | 150 + 11 + 7 + 12 = 180 | 4.39% |
|---|
| 4 | 6,800 | 270 + 18 + 15 + 23 = 326 | 4.79% |
|---|
| 5 | 22,500 | 1,020 + 81 + 118 + 142 = 1,361 | 6.05% |
|---|
| 6 | 5,300 | 205 + 14 + 9 + 17 = 245 | 4.62% |
|---|
| 7 | 9,700 | 410 + 30 + 26 + 41 = 507 | 5.23% |
|---|
| 8 | 3,900 | 140 + 10 + 6 + 11 = 167 | 4.28% |
|---|
| 9 | 11,200 | 470 + 35 + 37 + 50 = 592 | 5.29% |
|---|
| 10 | 7,400 | 300 + 21 + 17 + 27 = 365 | 4.93% |
|---|
| Mean | 9,500 | 502.7 engagements a post | 5.01% |
|---|
Post 1, worked through: 330 + 24 + 22 + 31 = 407 engagements, and 407 ÷ 8,200 × 100 = 4.96%. The mean of the ten rates is 5.01%, which the kit shows as 5.0%.
The other common version divides by followers instead of views. Hootsuite calls it engagement rate by post, says most influencers report their average this way, and tells brands to use it as a quick check on a creator. For the same ten posts it's 407 ÷ 12,400 × 100 = 3.28% for post 1 and 4.05% on average. The two numbers differ because these posts averaged 9,500 views, fewer than the account's 12,400 followers, so the same engagements divided by the smaller number give the higher rate. Put one in the kit, name the method next to it (“5.0%, by views, last 10 TikToks”), and give the other if a brand asks for it.
When a brand replies, it will ask what you charge. Our guide to brand deals for small accounts prices a rate card line by line.
Hootsuite also notes that YouTube Studio doesn't show an engagement rate, so for YouTube you add likes, comments and shares and divide by views yourself.
What does a rate card in a media kit look like?
A short list of things a brand can buy, each with one price. This one is priced by the rate calculator at its beginner defaults, with the typical figure on the card and the calculator's low to high range for reference. A story frame is priced as one photo.
Example media kit rate card, from the rate calculator's beginner defaults| On the card | Priced in the calculator as | Price (range) |
|---|
| One TikTok or Reel | 1 edited video, 15–30 s, organic use | $175
$100–$300 |
|---|
| One TikTok with a 30-day Spark Ads code | 1 video plus 1 month of whitelisting | $228
$130–$390 |
|---|
| Story set (3 frames) | 3 photos | $150
$90–$240 |
|---|
| Bundle: TikTok + story set + 30 days of paid ads | 1 video, 3 photos and 30 days of paid ads | $423
$247–$702 |
|---|
The calculator prices making the content and the rights to use it, from published UGC rate guides. It has no input for your reach. If a brand is paying for the audience on your account, add a posting fee as its own line and say what it's based on, such as your average views. To keep one version of the kit without prices, switch off “Show rates” in the builder.